Overview
Welcome to the DIY Chart. With it you can now create charts for your website, blog and social network profiles.
DIY Chart may be useful for those who need to visualize financial, scientific or other type of data.
A chart consists of numerous elements, the following figure illustrates the key elements that constitute a chart:
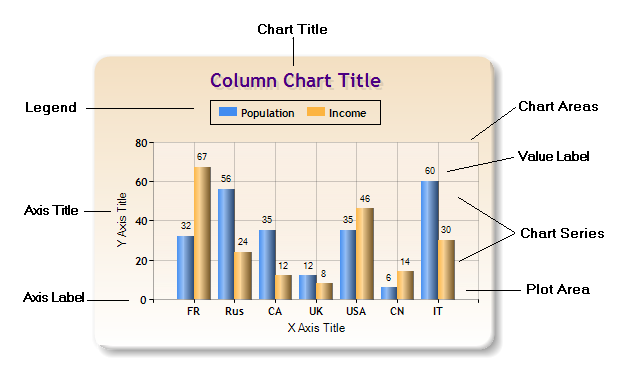
The following lists describes the major chart components:
Axis Label -
A label along an axis.
Axis Title -
The title of an axis.
Chart Area -
The chart picture consists of one or more chart areas, which are rectangular areas that are used to draw series, labels, axes, grid lines, tick marks, and so
on. Multiple series can be plotted in one chart area, depending on the chart types involved.The plot area, used to plot chart data, is also contained within
a chart area.
Chart Series -
A series is a related group of data points. Each series is associated with a chart type.
Legend -
A legend for the Chart picture. There can be an unlimited number of legends in a chart.
Plot Area -
The plot area is the inner rectangular area within a chart area that is used to plot series and grid lines. Labels, tick marks, the axis title, and so on,
are all drawn outside of the plotting area and inside the chart area. The plot area can be set via the ChartArea.InnerPlotPosition property.
Title - A main chart title.
Value Label - A special label that occurs for a data point, slightly offset from where the point is plotted. It can be the data point's value or custom text.
|